
Figure 1: On campus, I have been on the receiving end of racial discrimination
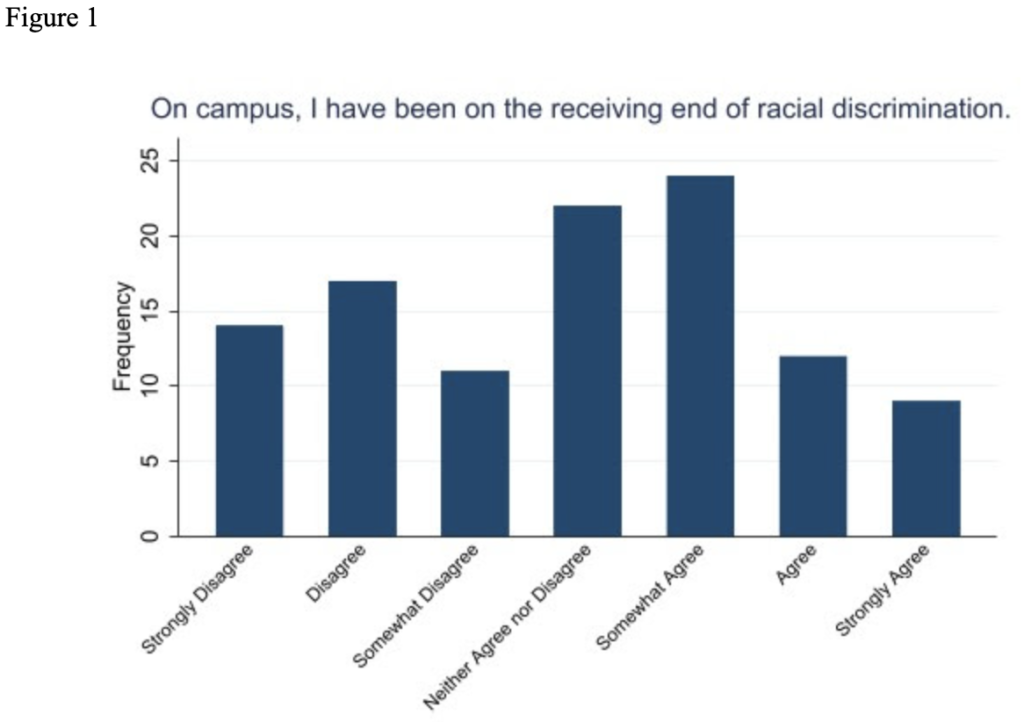
Figure 1 depicts participants’ responses to “On campus, I have been on the receiving end of racial discrimination”. There are 2 peaks: “Neither Agree nor Disagree” with 22 responses and “Somewhat Agree” with 24. The least number of responses was “Strongly Agree”, with 9 responses. The graph is not really skewed, but there are more responses on the disagree side rather than agree.
Figure 2: Within the community surrounding Hamilton, I have been on the receiving end of racial discrimination
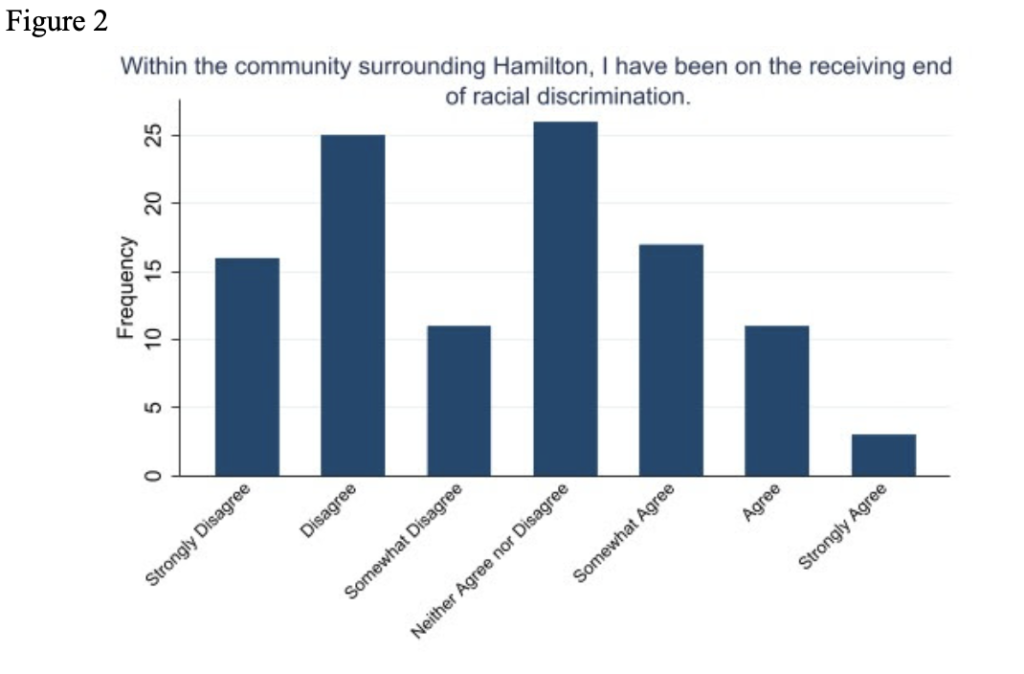
Figure 2 depicts participants’ responses to “Within the community surrounding Hamilton, I have been on the receiving end of racial discrimination”. There are 2 peaks: “Disagree” with 25 responses and “Neither Agree nor Disagree” with 26. The least number of responses was “Strongly Agree”, with 3 responses. The distribution is slightly skewed right. A possible explanation could be that students don’t have as much exposure to the communities surrounding Hamilton, but when they do, it’s either one extreme or the other.
Figure 3: My voice is represented on campus
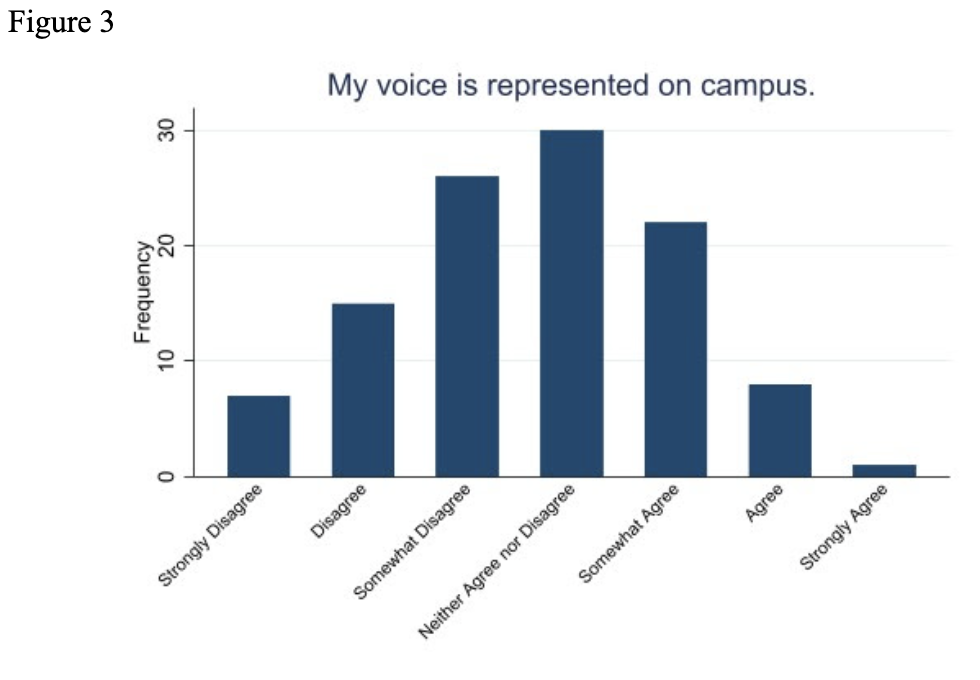
Figure 3 depicts participants’ responses to “My voice is represented on campus”. There is 1 peak: “Neither Agree nor Disagree” with 30 responses. The least number of responses was “Strongly Agree”, with 1 response. The distribution is approximately normal, but the ideal situation is having a left skewed distribution. There are more responses on the “disagree” side (that is, left to the “neither” category) than on the “agree” side. Participants do not believe that their voices are heard as much as they should, and the Asian & Asian American community at Hamilton would appreciate more support from cultural institutions such as the DMC to assist in guiding us through our initiatives to amplify our voices.
Figure 4: At Hamilton, I feel like I belong
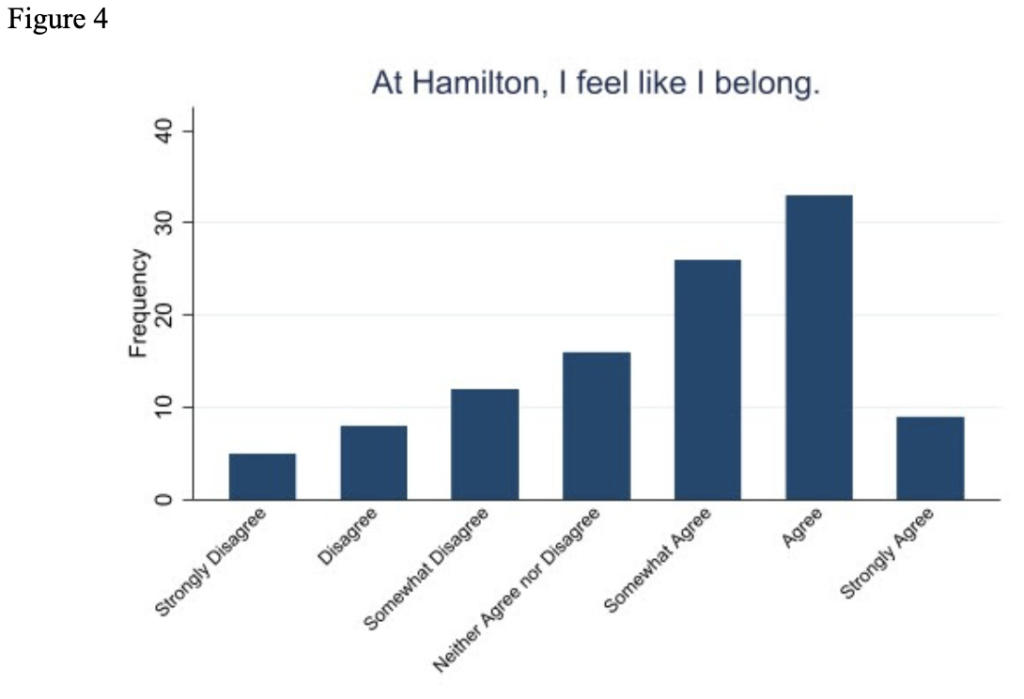
Figure 4 depicts participants’ responses to “I feel like I belong”. There is 1 peak: “Agree” with 33 responses. The least number of responses was “Strongly Disagree”, with 5 responses. Figure 4 depicts participants’ responses to “I feel like I belong”. There is 1 peak: “Agree” with 33 responses. The least number of responses was “Strongly Disagree”, with 5 responses. The distribution is skewed left. Participants generally feel like they belong at Hamilton; in other words, they feel that they fit in within the community. Although the majority of participants lie on the “agree” side, there aren’t many responses to the “strongly agree” category, meaning that there is still room for improvement at Hamilton.
Figure 5: I feel like I have to explain myself a lot because of my racial identity and cultural upbringing
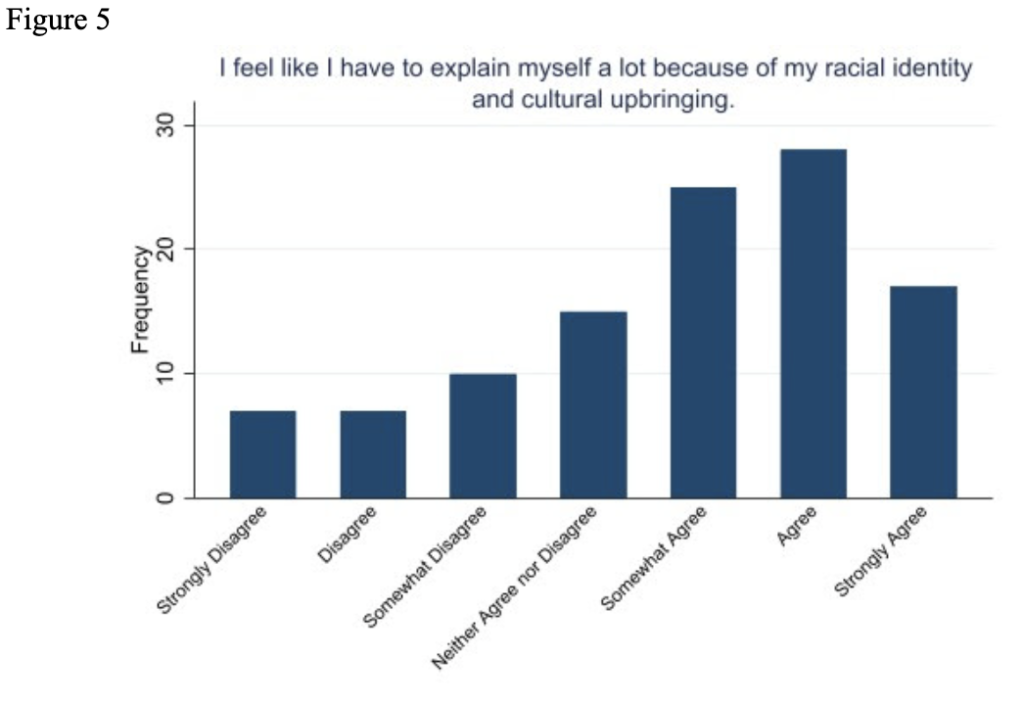
Figure 5 depicts participants’ responses to “I feel like I have to explain myself a lot because of my racial identity and cultural upbringing”. There is 1 peak: “Agree” with 28 responses. The least number of responses was both “Strongly Disagree” and “Disagree” with 5 responses each. The distribution is skewed left. Participants generally feel like they are misunderstood by others and feel the need to explain their background.
Figure 6: Hamilton does enough to support Asians and Asian Americans
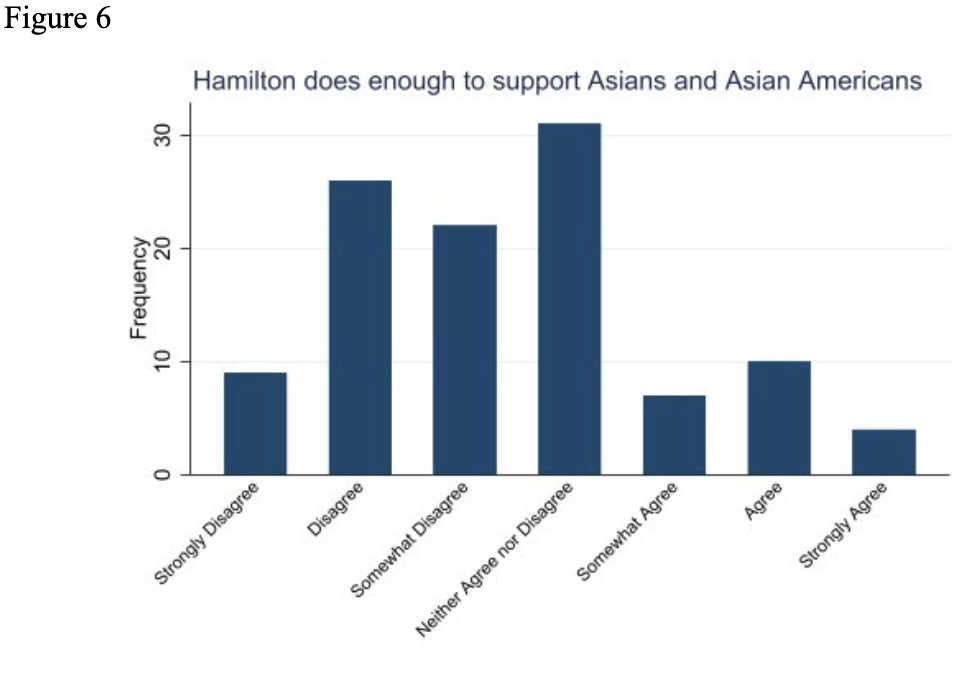
Figure 6 depicts participants’ responses to “Hamilton does enough to support Asians and Asian Americans”. There is 1 peak: “Neither Agree nor Disagree” with 31 responses. The least number of responses was “Strongly Agree” with 4 responses. The “disagree” side is clearly the majority in this distribution. For a question that is concerning support for marginalized groups, a neither agree nor disagree peak is not good enough. As we’ve seen this past year with the Atlanta spa shooting on March 16, 2021, campus was quiet and did not take further action than a campus wide email. We needed more support from the college, especially with such a horrible hate crime. It is clear that the attack was racially motivated; there were eight victims, six of whom were Asian women. With the majority of students residing on campus at this time, it is the college’s duty to ensure that their Asian and Asian American students are supported, especially when they’re away from home. We as students needed a safe space and for our voices to be heard.
Figure 7: There was a negative change in the campus atmosphere towards Asians after the pandemic
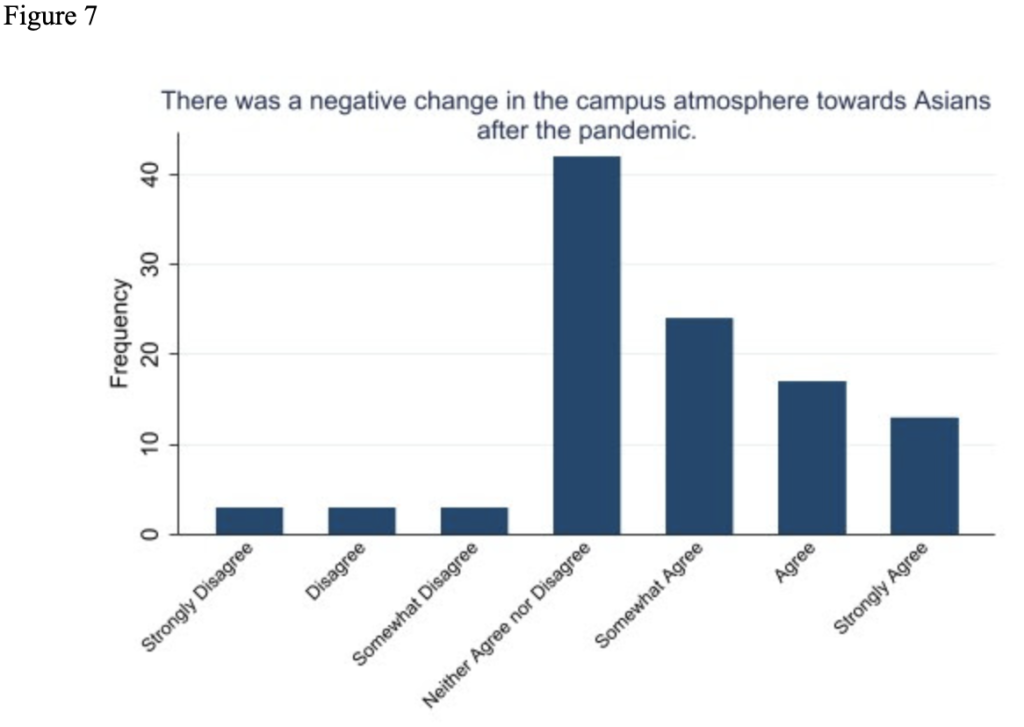
Figure 7 depicts participants’ responses to “There was a negative change in the campus atmosphere towards Asians after the pandemic”. There is a peak for: “Neither Agree nor Disagree” with 42 responses. There were the least responses on the Disagree-ing spectrum from “Strongly Disagree” to “Somewhat Disagree”. The distribution has significantly more responses on the spectrum of “Agree” than “Disagree”. We conclude that participants who chose “neither” were either unsure or hesitant to say that there was a “negative change” after the pandemic.
Figure 8: I think the pandemic changed people’s racial perceptions towards Asians
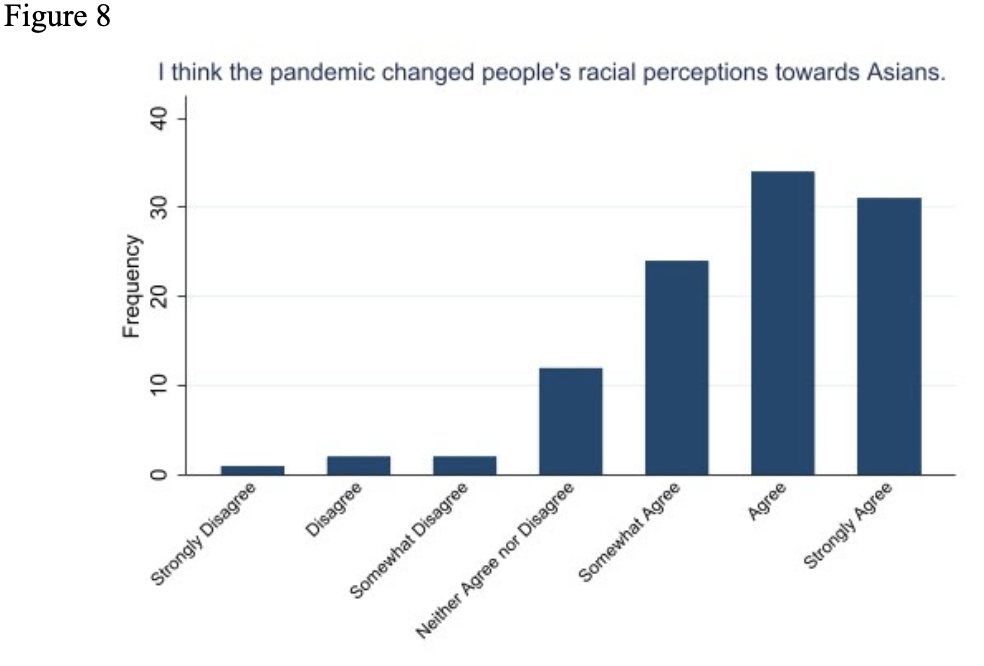
Figure 8 depicts participants’ responses to “I think the pandemic changed people’s racial perceptions towards Asians”. There is 1 peak: “Agree” with 34 responses. The least number of responses was “Strongly Disagree” with 1 response. The majority of participants agree that the Covid-19 pandemic has altered society’s racial perceptions towards Asians.
Although the question did not state negative or positive, the majority of participants agree that the pandemic had a large impact on society’s racial perceptions towards Asians as a group.
Figure 9 & Figure 10: Mental Health resources at Hamilton
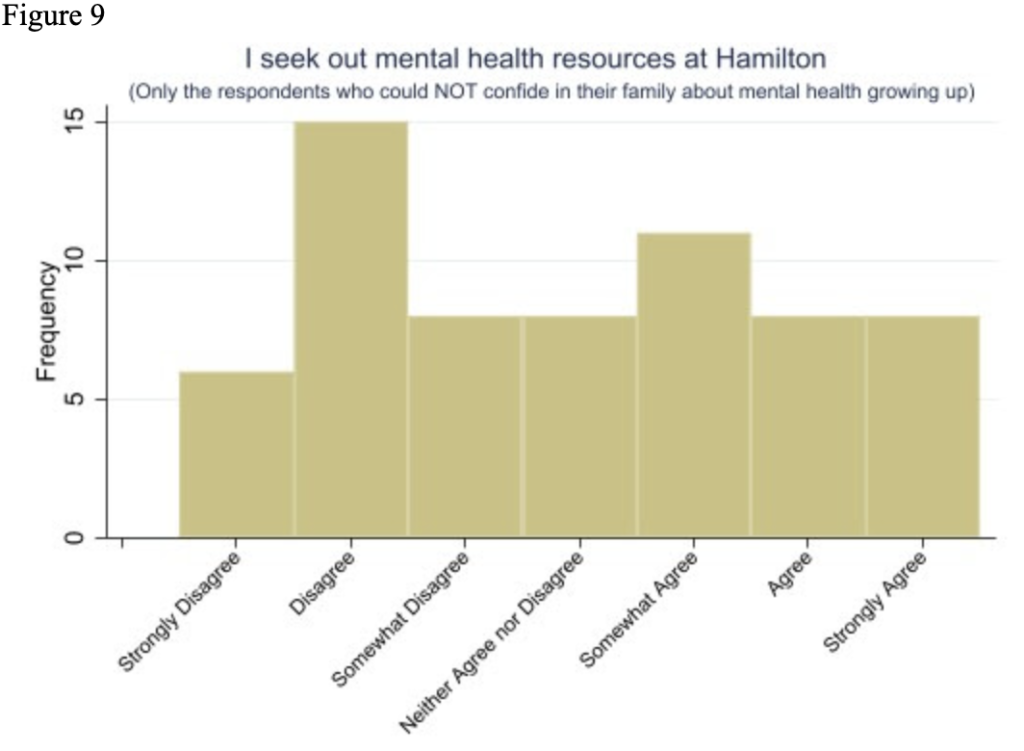
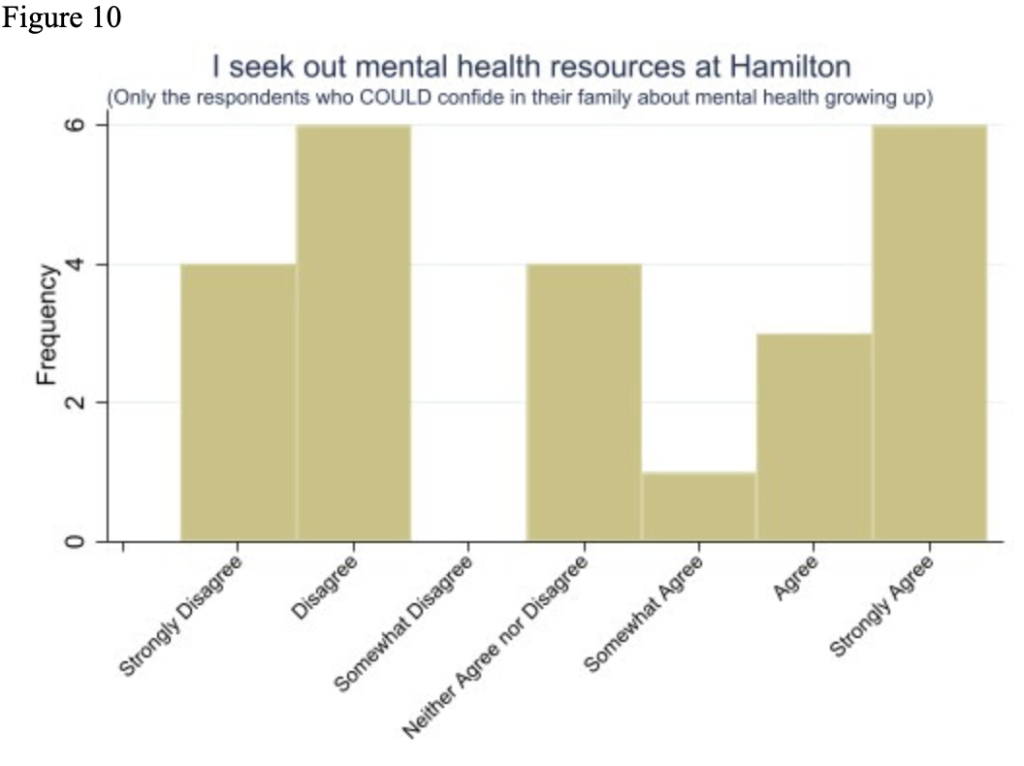
Figure 9 depicts a conditional statement: If a participant could not confide in their family about their mental health growing up (from “Strongly Disagree” to “Somewhat Disagree”), then what is the distribution of them seeking out mental health resources at Hamilton. There is 1 peak: “Disagree” with 15 responses. The least number of responses was “Strongly Disagree” with 6 responses. The distribution is approximately uniform excluding the peak. Of those that could not confide in their family about their mental health growing up, there is a uniform distribution. Whether a family serves as a confidant for their children about their mental health or not, it does not seem to impact whether the participant seeks out mental health resources at Hamilton.
Figure 10 depicts a conditional statement: If a participant could confide in their family about their mental health growing up (response more than 4), then what is the distribution of them seeking out mental health resources at Hamilton. There are 2 peaks: “Disagree” and “Strongly Agree” with 6 responses each. The least number of responses was “Somewhat Agree” with 1 response. Of those that could confide in their family about their mental health growing up, the distribution seems unclear. Whether a family serves as a confidant for their children about their mental health or not, it does not seem to impact whether the participant seeks out mental health resources at Hamilton.