
Minority/Majority
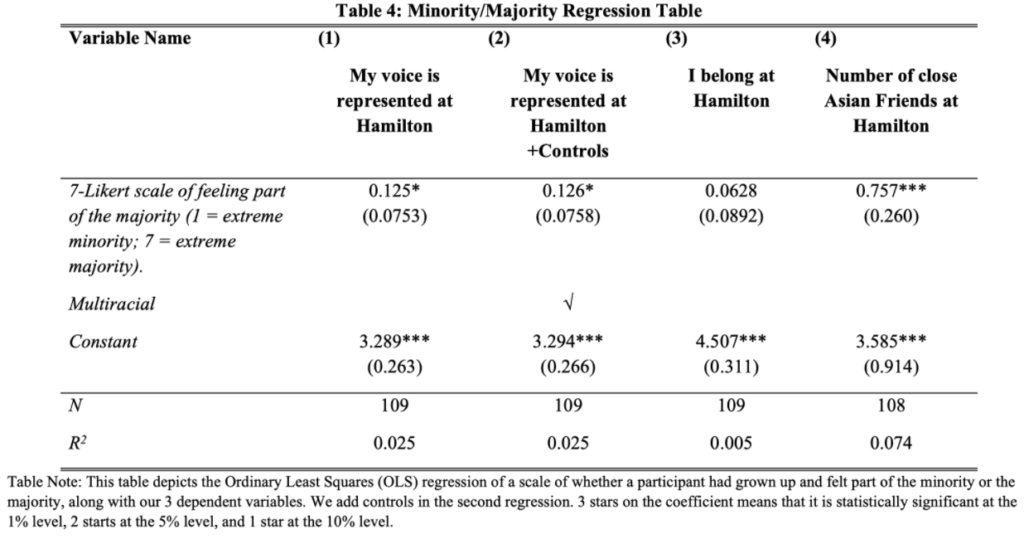
Table 4 depicts the Ordinary Least Squares (OLS) linear regression between the variables minority/majority and the 3 dependent variables: “My voice is represented at Hamilton”, “I belong at Hamilton” and number of close Asian friends at Hamilton.
As mentioned earlier, the majority of our variables are on 7-point Likert scales. Our dependent variables have a value of 1 if a participant strongly disagrees, and has a value of 7 if a participant strongly agrees. Pertaining to our main explanatory variable, a value of 1 means that the participant grew up in an extremely minority group, while a value of 7 means that the participant grew up in an extremely majority group.
In column 1, we see that if a participant was leaning towards being part of the majority growing up, it is positively associated with the feeling of having their voice represented on campus. The coefficient is statistically significant at the 10% level. One unit increase in the majority question (e.g., Strongly disagree-> Disagree; Neither -> Somewhat agree, etc.) is associated with a 0.125 increase in the 7-point scale representation variable. The effect size is quite minimal: even with the most extreme change in our independent variable (1->7), the dependent variable only changes by 0.75, less than a single unit change. Even when we add controls in the second column, the coefficient stays relatively the same and is still statistically significant at the 10% level. Being multiracial does not correlate with growing up in the majority or minority, and does not affect if a participant believes that their voice is represented.
In column 3, we see that if a participant was leaning towards being part of the majority growing up, it is positively associated with the feeling of belonging at Hamilton. However, this relationship is rather weak and is not statistically significant. One unit increase in the majority question is associated with a 0.0628 increase in the 7-point scale belonging variable. The effect size is quite minimal: even with the most extreme change in our independent variable (1->7), the dependent variable only changes by 0.3768, less than a single unit change.
In column 4, we see that if a participant was leaning towards being part of the majority growing up, it is positively associated with having more close Asian friends at Hamilton. The coefficient is statistically significant at the 1% level; there is a strong positive relationship. One unit increase in the majority question is associated with a 0.757 increase in the number of close Asian friends at Hamilton variable.
Participants’ need to explain theirselves due to racial identity & cultural upbringing
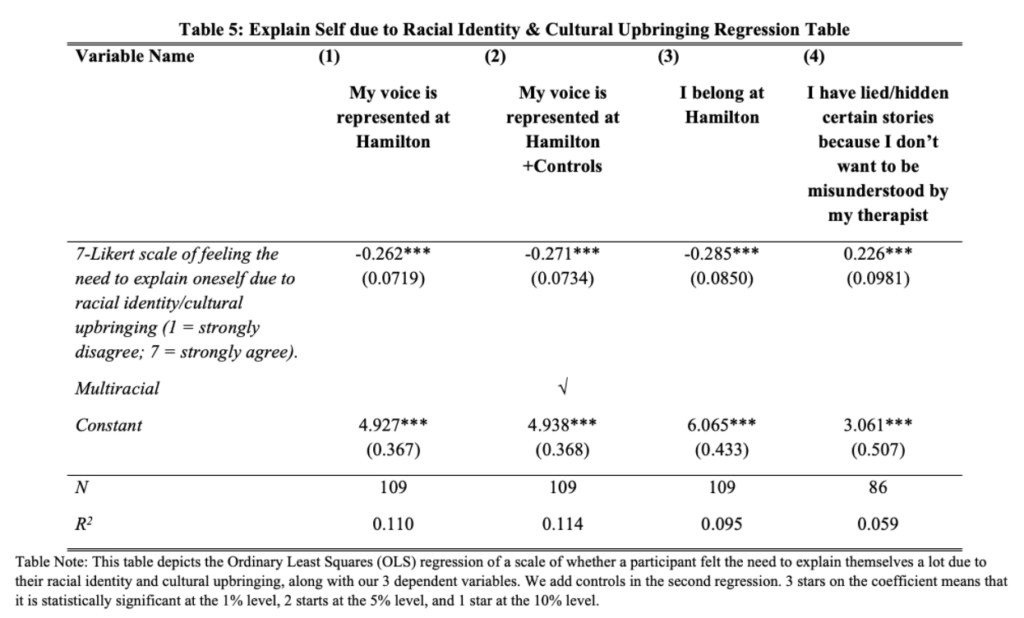
Table 5 depicts the Ordinary Least Squares (OLS) linear regression between the variables “I feel like I have to explain myself a lot because of my racial identity and cultural upbringing” and the 3 dependent variables: “My voice is represented at Hamilton”, “I belong at Hamilton” and “I have lied/hidden stories because I don’t want to be misunderstood by a therapist”.
In column 1, we see that if a participant feels the need to explain themselves due to their racial identity, it is negatively associated with the feeling that their voice is represented at Hamilton. The coefficient is statistically significant at the 1% level. One unit increase in the explain self question is associated with a 0.262 decrease in the 7-point scale representation variable. Even when we add controls in the second column, the coefficient stays relatively the same and is still statistically significant at the 1% level. Being multiracial does not correlate with feeling the need to explain oneself, nor does it affect if a participant believes that their voice is represented. If an individual feels that no one understands or could relate to them, they can feel isolated and their voice left unheard.
In column 3, we see that if a participant feels the need to explain themselves due to their racial identity, it is negatively associated with the feeling of belonging at Hamilton. The coefficient is also statistically significant at the 1% level. One unit increase in the explain self question is associated with a 0.285 decrease in the 7-point scale belonging variable. If an individual feels that no one understands or could relate to them, they’ll again feel alone and isolated within campus.
In column 4, we see that if a participant feels the need to explain themselves due to their racial identity, it is positively associated with hiding stories from their therapist due to the fear of being misunderstood. The coefficient is statistically significant at the 1% level. One unit increase in the explain self question is associated with a 0.226 increase in the 7 point scale lying to their therapist variable. If an individual feels that no one understands or could relate to them, it could increase the probability that they hide stories from their therapist to reduce further explanation.