By Nate Cohen
Physical geography dictates so much about place. For any given place, the physical landscape can drastically affect migration patterns, economic development, environmental conservation, and weather. It also frequently dictates the density, class, and racial composition of an area. In this blog post, I will examine the intersection of physical and human geography in my home region, Long Island.
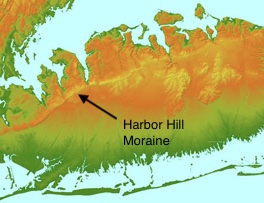
Across both of its counties, Long Island is highly segregated. Indeed, among similar-sized counties, the 2010 census ranked Nassau County as the most segregated (Winslow 2019). Using the same metric, Suffolk County was ranked the 10th most segregated nationally (Winslow 2019). Interestingly, segregation patterns closely track the physical geography of the region. Below, is a topographic and satellite map of Western Long Island.
Hofstra University
Department of Geology
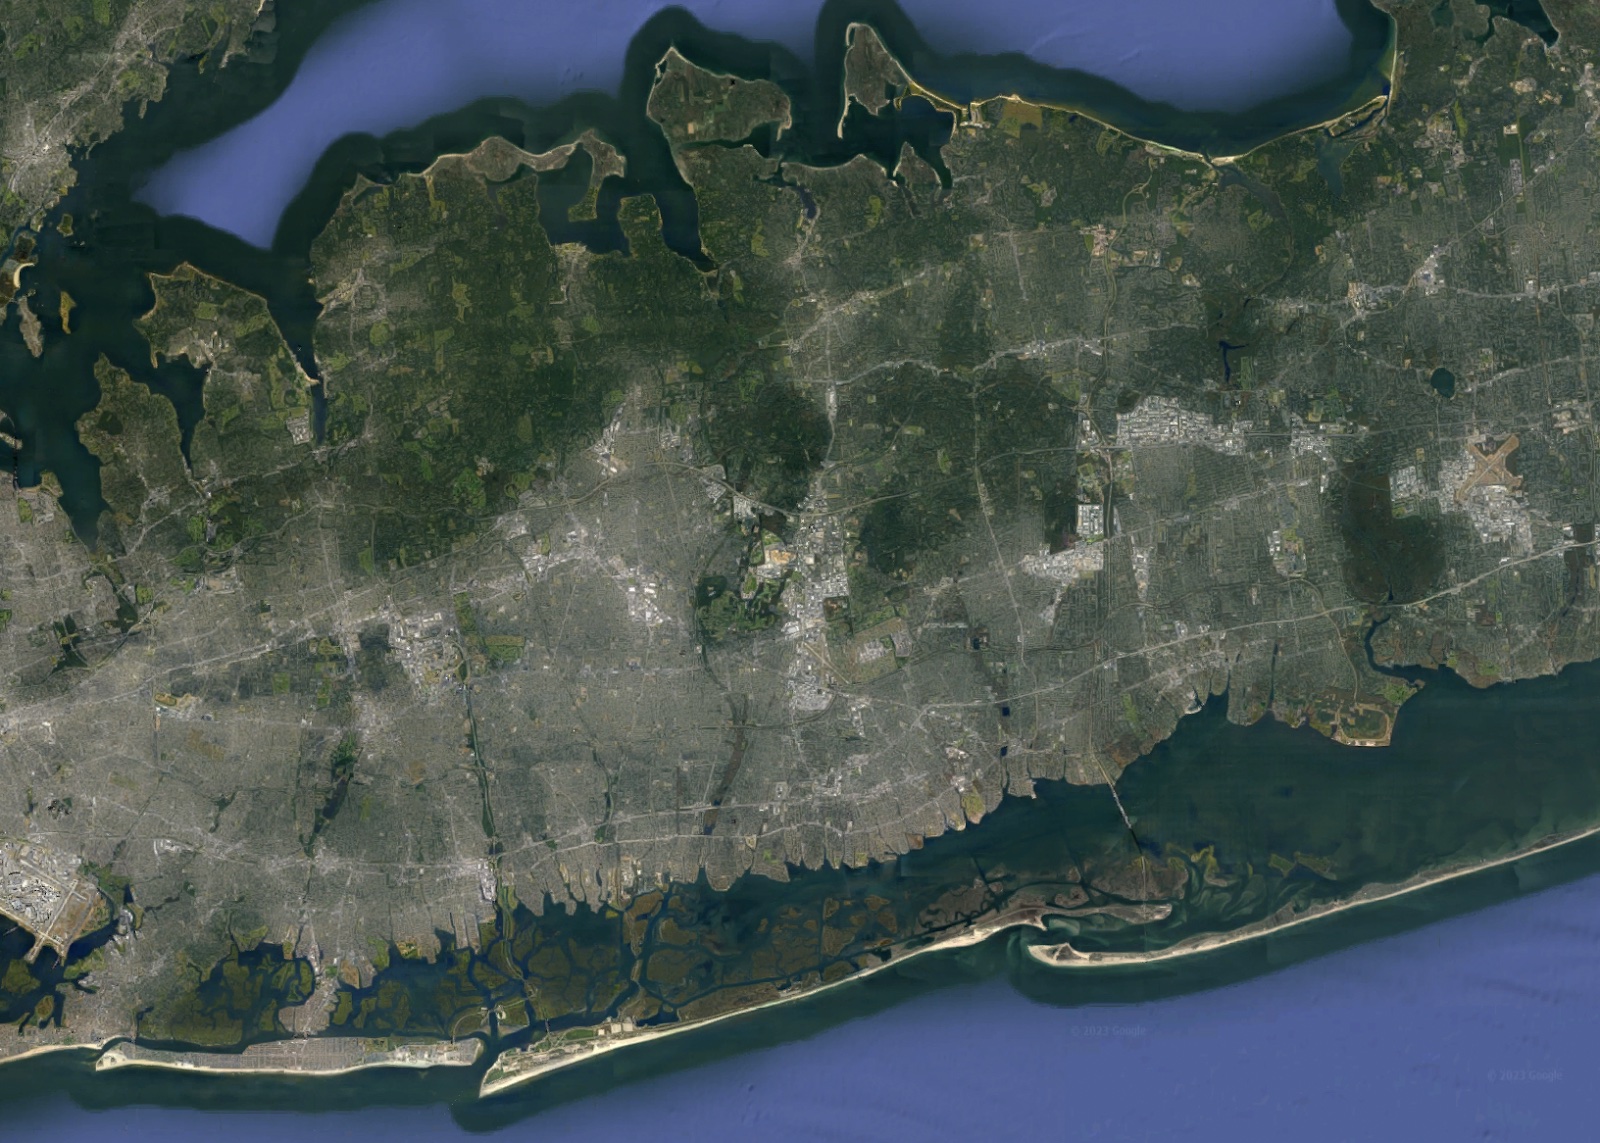
Source: Google Maps
The topographic map illustrates the Harbor Hill Moraine, the chain of hills roughly demarcating the North Shore region. Now, compare this to the satellite map. As you can see, there is a development divide that roughly follows the moraine. North of the moraine, there is a lot of greenery. South of the moraine, there is more dense development.
Geography may help explain this different development pattern. North of the moraine, there are a variety of peninsulas of higher elevation, 200 to 300 ft above sea level. These elevations drop rapidly to meet sea level at the Long Island Sound, making the area hilly. These hills, combined with the lack of geographic continuity, hinder urban sprawl. Moreover, its isolation, and waterfront access, make the North Shore an alluring place for the wealthy.
While water serves as a barrier to roadway development and urban sprawl on North Shore peninsulas, the continuity of land south of the moraine facilitates such development. In turn, the greater abundance of noisy, polluting highways and cheap, dense housing renders the area less attractive for the wealthy.
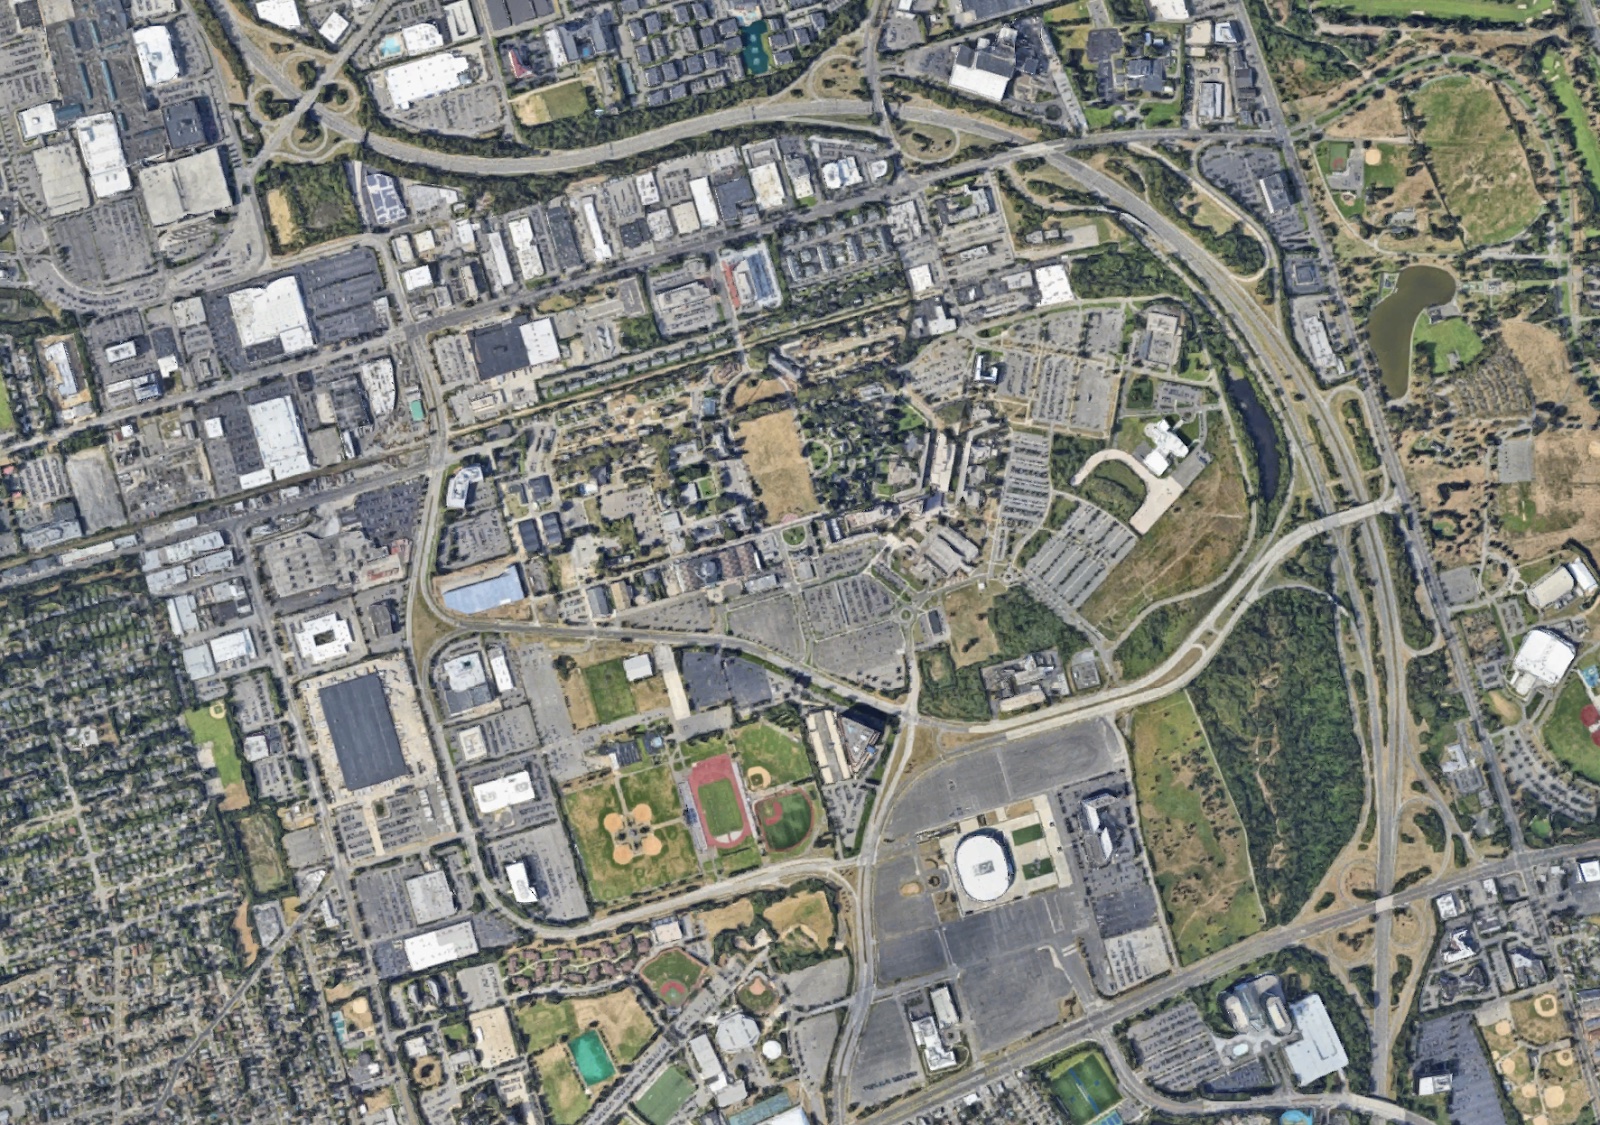
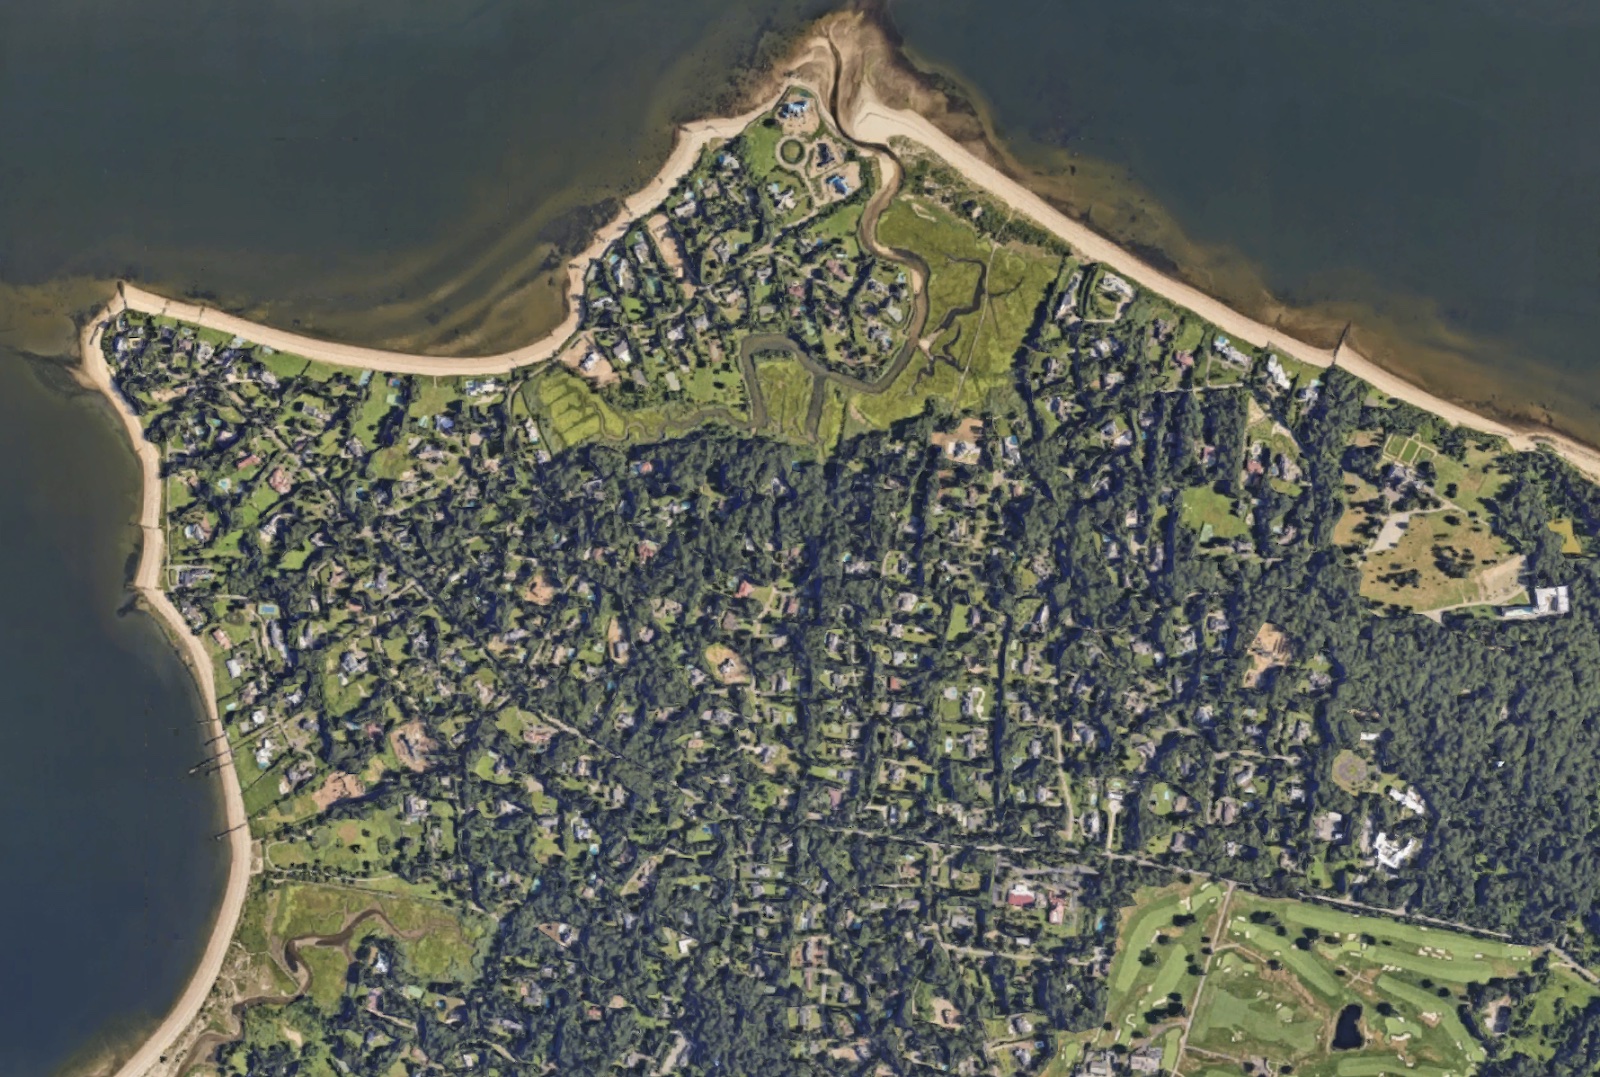
The satellite photos below illustrate the stark difference in development for two communities on opposite side of the moraine. The first photo shows the Village of Hempstead. Located in the flat, continuous region south of the moraine, the village is dominated by dense developments, parking lots, parkways, and boulevards. In Hempstead, the population is 13% White, with a median household income of $74,680 (“Hempstead Village”). By contrast, the second photo shows the Village of Sands Point. At the tip of the hilly Cow Neck peninsula, this village is characterized by winding roads, water vistas, spacious properties, and a large nature preserve. The population is 87% White, with a median household income of more than $250,000 (“2021 ACS: Median Income” ; “2021 ACS: Demographics”).
While the differences between these municipalities are extreme, they are not exceptional. Census data confirms the radically higher affluence of most North Shore communities. Located entirely south of the moraine, households in the Town of Hempstead earn approximately $15,000 less than the neighboring North Shore towns of North Hempstead and Huntington (“Hempstead Town”; “North Hempstead Town”; “Huntington Town”).
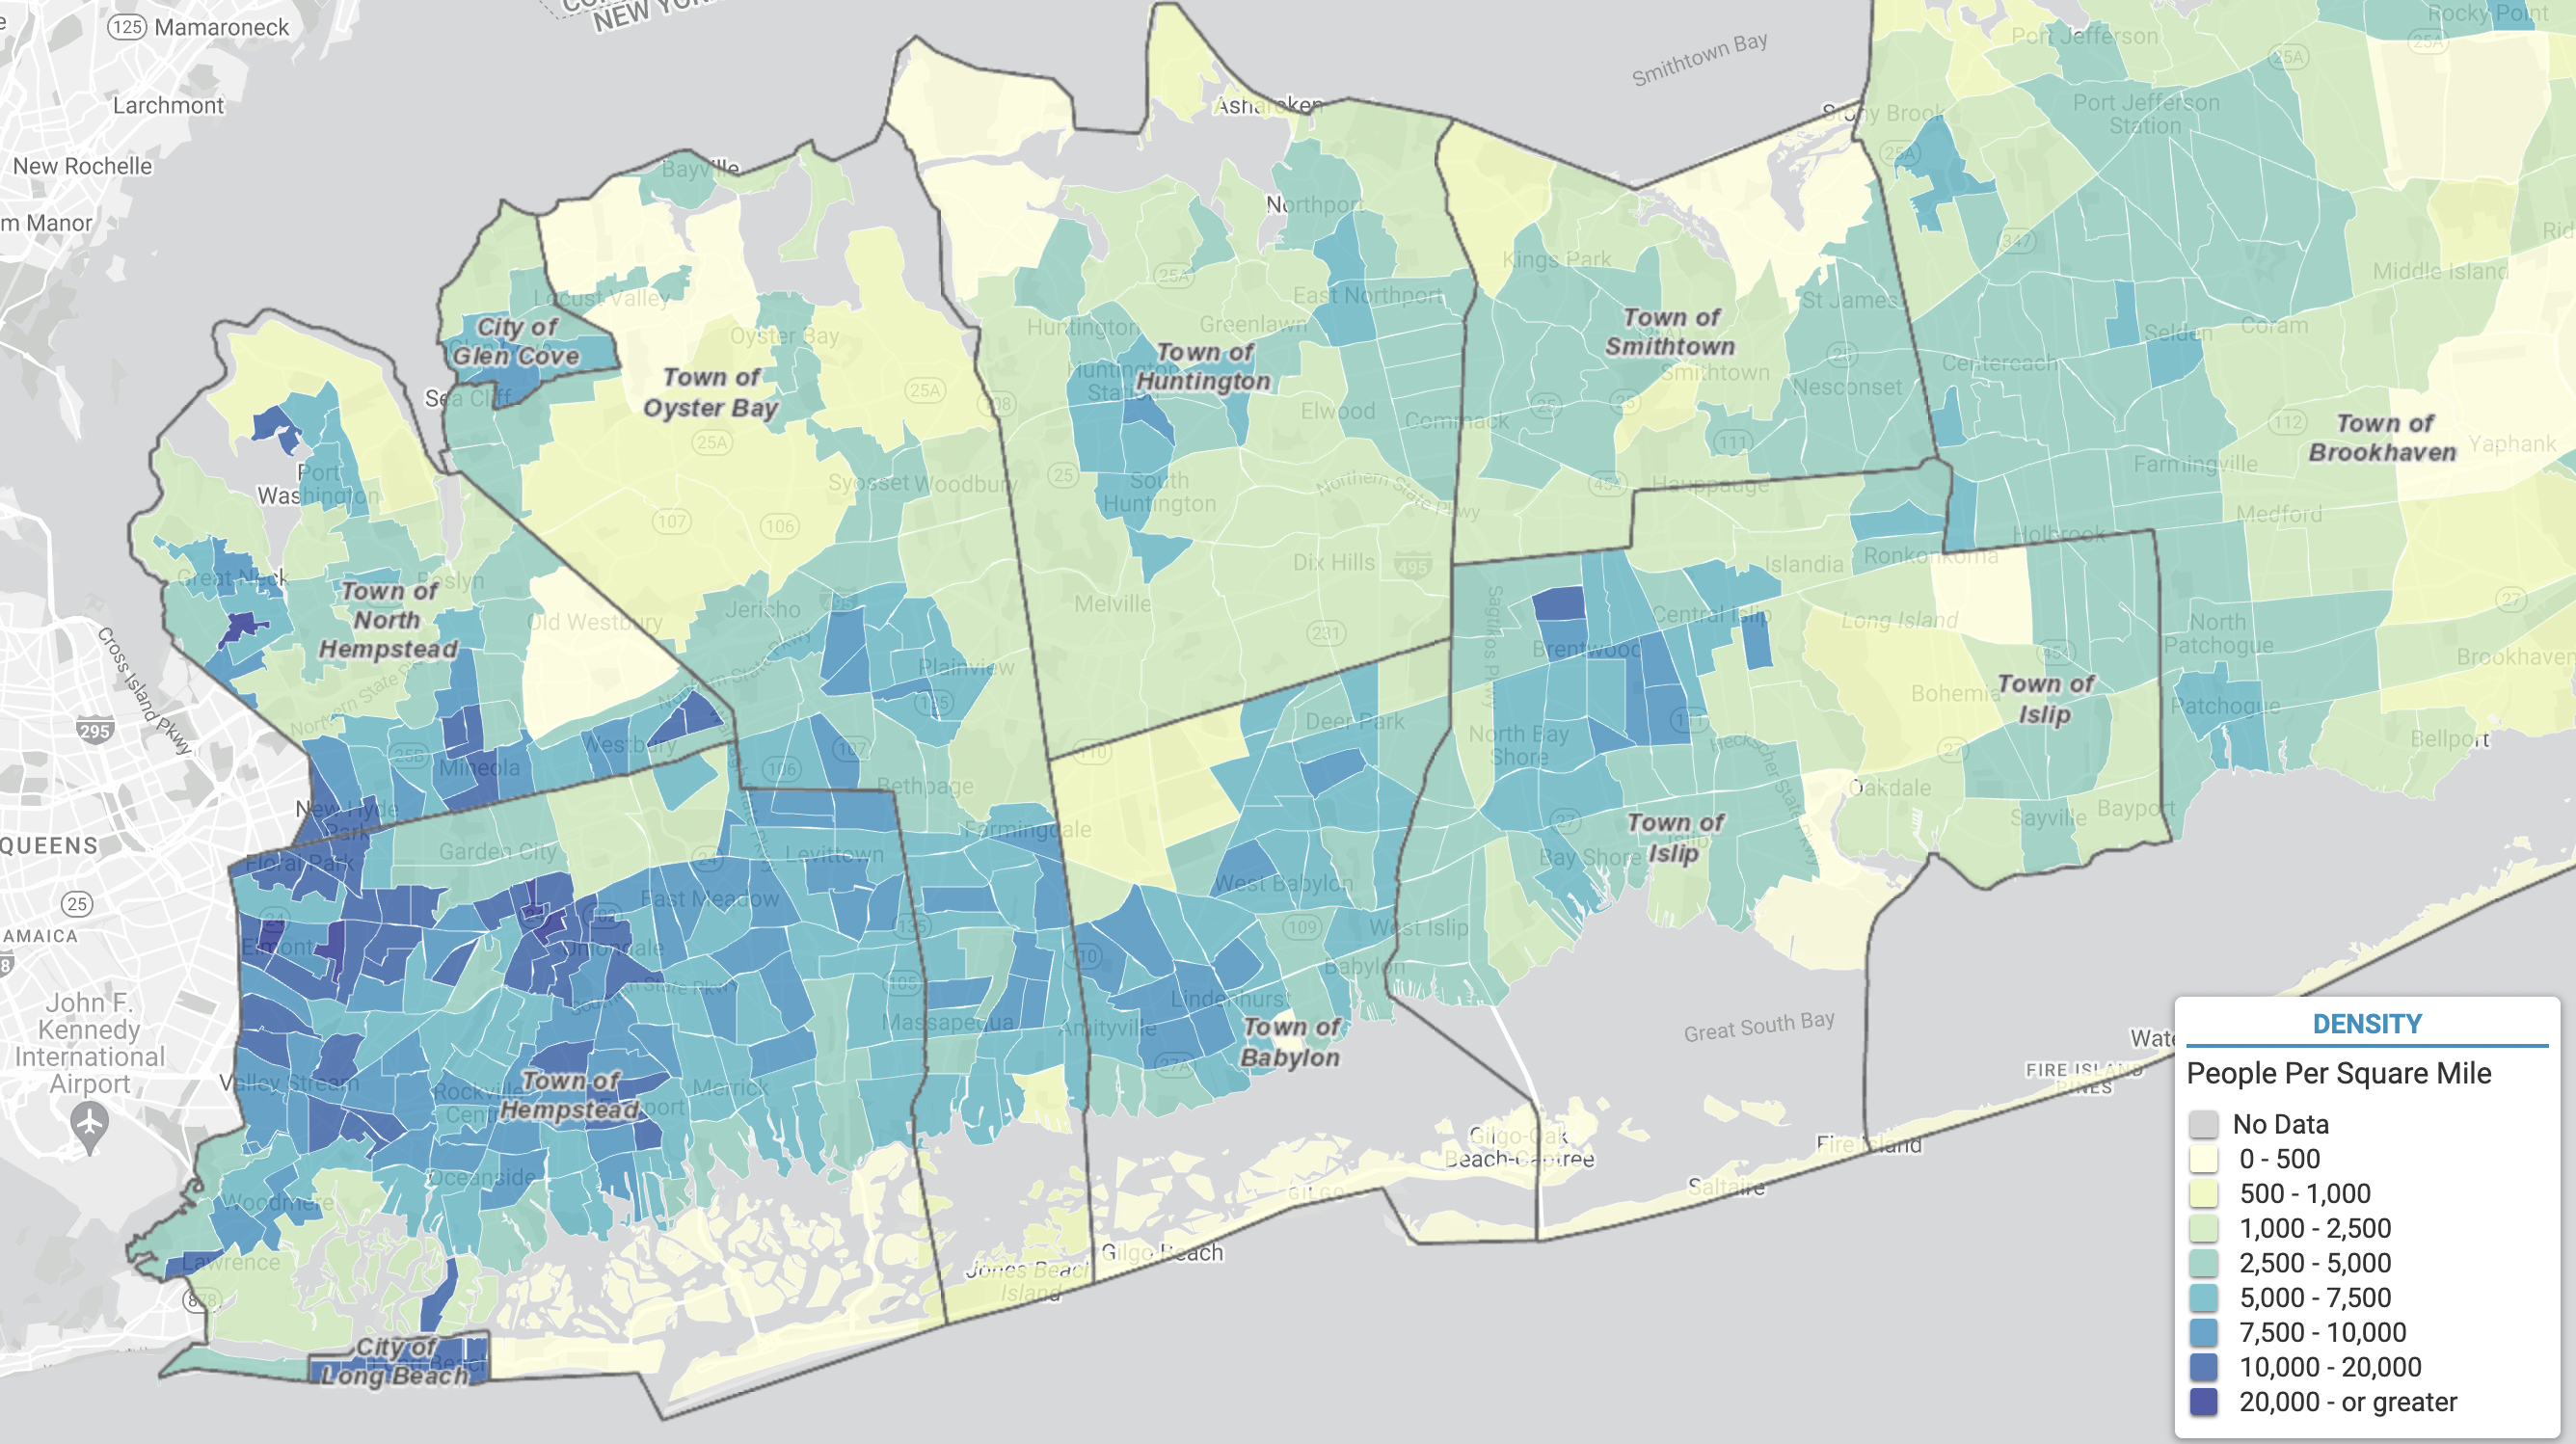
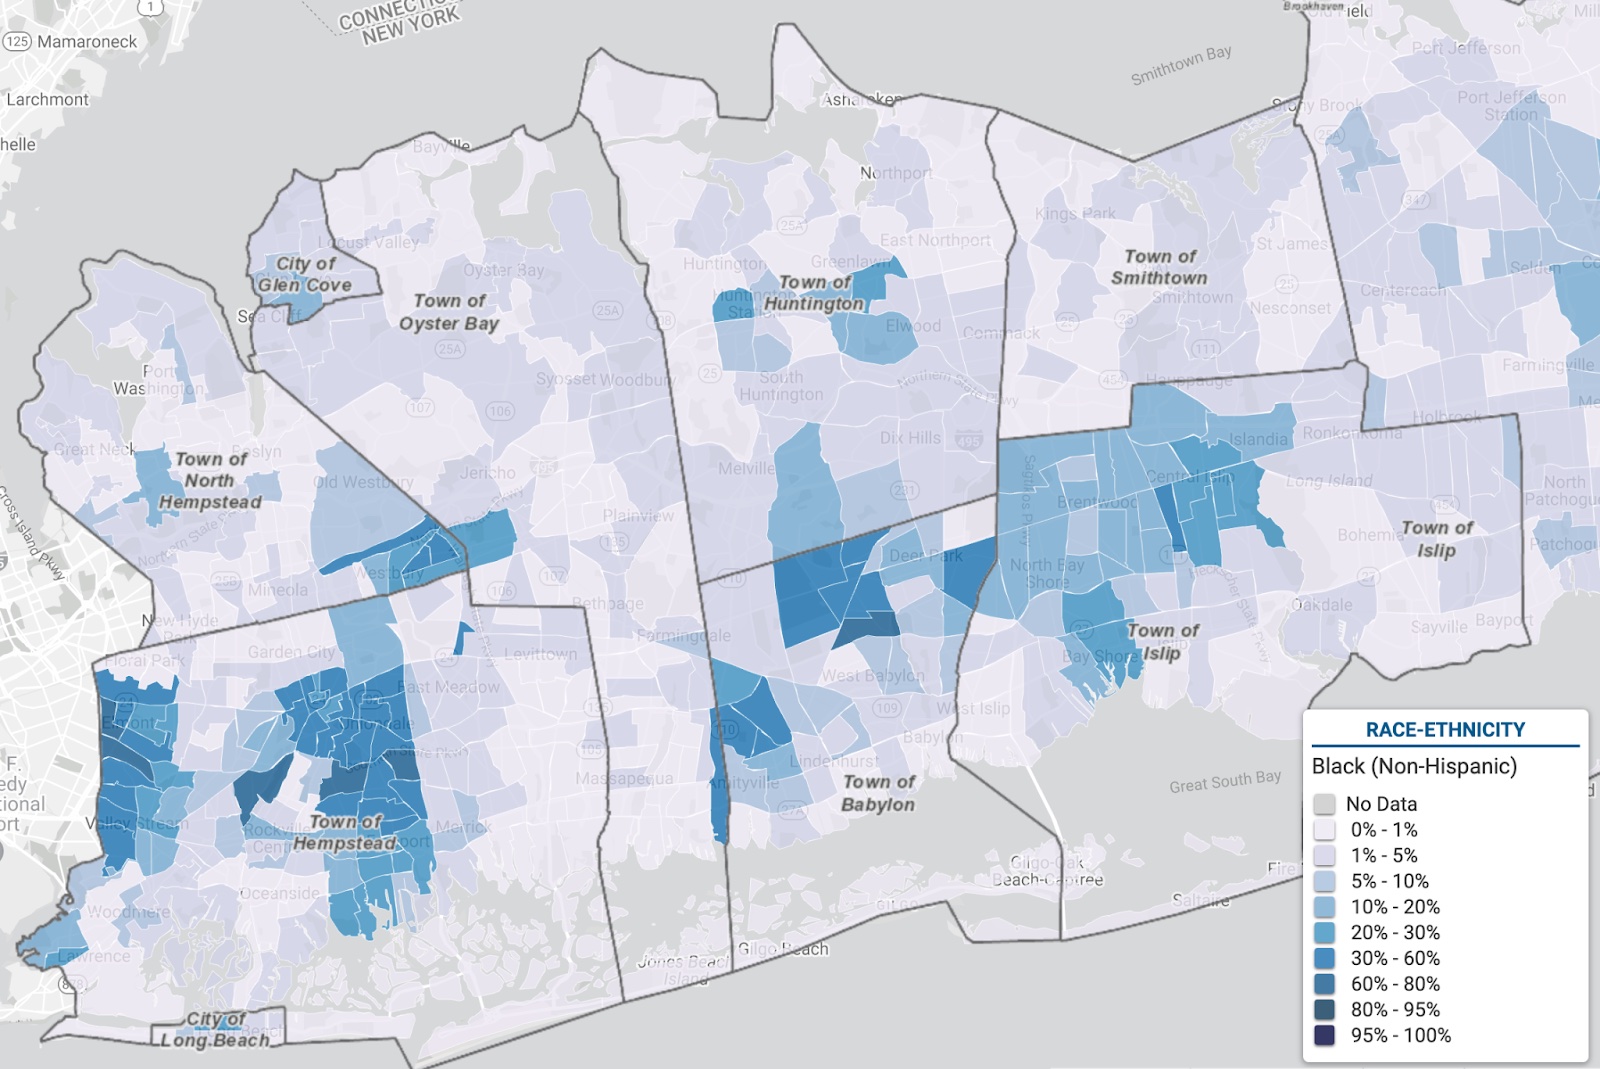
Census data also confirms how patterns of development and racial geography are split by the island’s topography. For the wealthier, hillier, and waterfront town of Huntington, the population density is 2,170.7 people/mile (“Huntington Town”). Moreover, the town has a minuscule Black population, representing just 4% of Huntington (“Huntington Town”). By contrast, the flat and contiguous town of Hempstead has over triple the density, 6,694.7 people/mile, and quadruple the percentage of Blacks, comprising 17.3% of the population (“Huntington Town”). These disparities are summarized by the maps below (“Historic Census”).
As a caveat, while I believe physical geography helped produced these disparities, I do not for certain. This finding is not grounded in peer-reviewed research, but observations from maps and census data as well as my personal experience. Yet, given the clear geographic patterns of my observations, I suspect a more formal study would confirm my hypothesis.
Moreover, there is some ambiguity to the moraine’s demographic divisions. Garden City is an affluent, White suburb, yet it is located south of the moraine. However, this does not so much disprove my theory, as clarify it. While there are some affluent communities south of the moraine, there are also some poor areas. By contrast, there are virtually no poor areas on the North Shore
Overall, I hope this blog calls attention to how physical geography produces unequal development. In discussions of social and racial justice, this factor is too often overlooked. To attain a more complete understanding of racial and economic segregation, we should always investigate the role of the physical landscape.